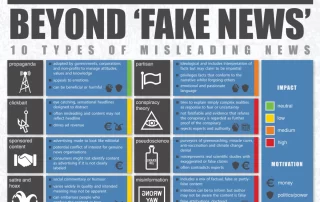
Infographic: Beyond Fake News – 10 Types of Misleading News – 17 Languages and counting
Did you know that our infographic has been translated into 17 languages since it was created a few years ago? According to the Digital Economy and Society Index Report 2020 released by the European Commission this month, Internet use continued to increase year-on-year with 85% of Europeans surfing the internet at least once per week in 2019 (up from 75% in 2014). This increased level of Internet use is also likely to be sustained by the coronavirus pandemic as people's movements are restricted and are spending more time at home. In the meantime, disinformation [...]

Beyond The Headlines – The Online News Verification Game
Beyond The Headlines is EAVI's online news verification game. We developed it with the help of some of EAVI's individual members and have tested it at our Beyond Fake News workshop at ECAS with a great response.

Infographic: Beyond Fake News – 10 Types of Misleading News – Seventeen Languages
Introducing our new infographic 'Beyond Fake News' and some resources to use it with.

Press Release: European Parliament Votes for Media Literacy
EAVI is pleased to announce that, following its long and tireless medial literacy for Citizenship Campaign, media literacy measures have been adopted by the European Parliament’s Committee for Culture and Education to put media literacy back into the Audiovisual Media Services Directive (AVMSD).
INFOGRAPHIC: The EAVI Guide to Privacy and Tracking
Tracking is an inconvenient truth and so is looking after our own security online. It can be unsettling knowing that advertisers are following our every move in order to serve us ads while we navigate the web. Our guide shows you how online tracking works and a few tweaks and recommendations for limiting the amount that you are tracked online and increasing your privacy.
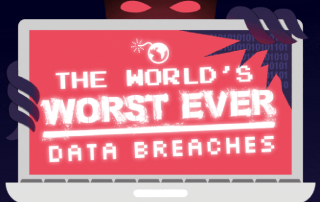
INFOGRAPHIC: The World’s Worst Ever Data Breaches
The unprecedented data leak of the Panama Papers taught us much about the extent of global tax evasion, however following several successive high-profile leaks in recent years, most famously perhaps, Edward Snowden's leak of NSA records, we might consider the real lesson to be that one's data is never really safe.