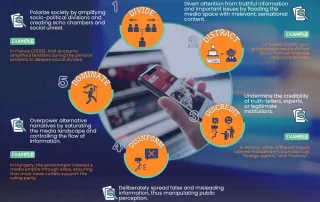
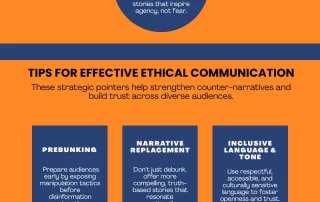
The Strategic Sequence of Disinformation: 5Ds in Action
Disinformation does not simply emerge randomly; it follows a calculated sequence designed to manipulate public perception, distort truth, and ultimately control narratives. The infographic illustrates how five interconnected strategies – Divide, Distract, Discredit, Disinform, and Dominate – work together to weaken trust in institutions, polarise societies, and shape opinions. Understanding these tactics is essential for recognising how falsehoods spread and for strengthening resilience against manipulation. Divide: Misleading news often exploits and deepens existing social and political rifts. The architects of falsehoods create echo chambers that intensify polarisation and escalate societal conflicts. Social media provides [...]

Online privacy: Tips
Online privacy refers to how much of your personal, financial and browsing information remain private while you are online. Our privacy in the online world is as significant as our privacy in the offline one. For example, we would never share our bank account details, passwords, personal details, and home address with people we do not know. But, then, why share all these online? Even though it is significant, it may seem hard sometimes to stay safe and secure online, especially when it comes to social media networks. How can you securely share your [...]

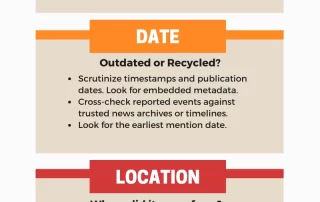
How to read a photograph?
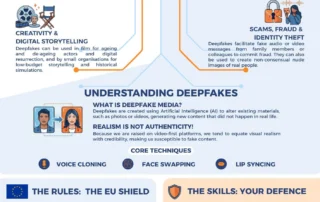
Misleading content, as a form of disinformation, can be found everywhere and can have different forms, from titles to whole texts and images to videos. Visual content, especially misleading images, play a role in our online activities and can be generated for various reasons. We can even find them in social media with special effects and editing software or even in random articles. They are a part of our new online reality, and in most cases, they tend to alter our perceptions about reality, harm our well-being and our role in societies. But how [...]
Why do people believe in conspiracy theories?
Conspiracy theories aren't something new. They have existed since the beginning of mankind and are part of every modern society. What changed is that in the last few years they have become a popular topic of discussion. So what are conspiracy theories, who do they affect and why do people still believe in them? Learn more in the new infographic that was created by EAVI. Download the infographic
Let’s talk about media literacy!
What is media literacy? Why is it significant? And how individuals and broader societies can benefit through media literacy? This infographic aims to provide the most significant points of media literacy, its goal and its benefits in a concise way. It is suitable for everyone interested in exploring more about media literacy. Download the infographic